Tableau 10 gives users the features they want
Tableau, the flagship visual tool for analytics and BI, wanted its 10.0 edition to be truly worthy of another digit in front of the decimal point.
The self-dubbed “Google of data visualization” shaped version 10.0 based on feedback from its user community, and paired that with an all-new visual design intended to make Tableau both more attractive and easier to use.
An eyeful of info
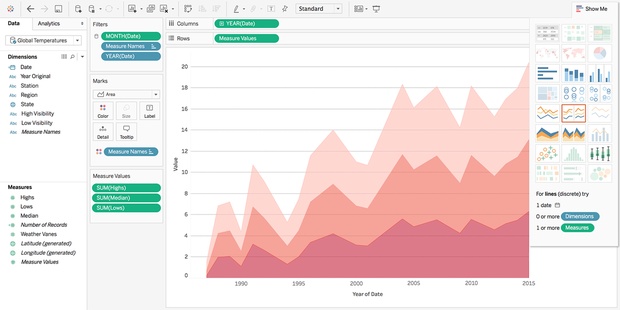
The most prominent outward feature of Tableau 10 is a redesigned interface that’s more in line with a Bootstrap-powered website than the legacy toolbar-and-panel desktop-app look found in previous versions of the app.
Tableau 10’s refined interface hews closer to a Bootstrap-powered web app than a desktop app — both for the sake of consistency across devices and the aesthetic appeal of such a look.
That mobile-esque look is no accident. Tableau has a habit of leveraging trends in mobile devices and web interfaces, such as its Vizable app for data exploration. The company has also provided a tool for designing dashboards that are useful on both desktops and mobile devices, and has commissioned custom-designed fonts to make data legends more legible.
Some of the new UI behaviors in Tableau, though, just refine or expand on conveniences that already existed in the program. Cluster maps, for instance, can now be created by dragging and dropping data inputs, and a “highlighter” function allows specific fields in a visualization to be given prominence — useful for calling out a value in a line chart, for instance.
Tell us what you want
But Version 10 isn’t about any one feature. Rather, it’s about new features being driven by user feedback in the product’s forums.
Users heavily requested new methods for pulling in external data — features that are Tableau’s lifeblood. So the ability to join data from different sources, to join extracts from separate data sources, and to filter data across multiple sources (also known as “dynamic parameters“) all made it into the finished product.
Tableau 10 also changes how it works with teams and communicates with its users — e..g, creating dashboard subscriptions for other users, or alerting a user by email when data in an extract cannot be refreshed. Other features involve broader use of geographic data (and more of it), and supplying push notifications to subscribers.
The previous version of Tableau, released in 2015, was positively reviewed by InfoWorld’s Martin Heller, and has been facing pressure from competitors like QlikTech’s Qlik Sense and Microsoft’s Power BI. But both of those products had a hard time stacking up to Tableau when we last looked into them.
Qlik Sense isn’t anywhere nearly as easy to use; Power BI, despite being able to hook into a staggering array of data sources, isn’t as malleable in its presentation. Even if Tableau is already ahead of its competitors, it’s clearly planning to keep its lead by keeping close tabs on its users’ needs and by not letting legacy look-and-feel issues hold it back.
Source: InfoWorld Big Data


