Tap the power of graph databases with IBM Graph
Natural relationships between data contain a gold mine of insights for business users. Unfortunately, traditional databases have long stored data in ways that break these relationships, hiding what could be valuable insight. Although databases that focus on the relational aspect of data analytics abound, few are as effective at revealing the hidden valuable insights as a graph database.
A graph database is designed from the ground up to help the user understand and extrapolate nuanced insight from large, complex networks of interrelated data. Highly visual graph databases represent discrete data points as “vertices” or “nodes.” The relationships between these vertices are depicted as connections called “edges.” Metadata, or “properties” of vertices and edges, are also stored within the graph database to provide more in-depth knowledge of each object. Traversal allows users to move between all the data points and find the specific insights the user seeks.
To better explain how graph databases work, I will use IBM Graph, a technology that I helped to build and am excited to teach new users about. Let’s dive in.
Intro to IBM Graph
Based on the Apache TinkerPop framework for building high-performance graph applications, IBM Graph is built to enable and work with powerful applications through a fully managed graph database service. In turn, the service provides users with simplified HTTP APIs, an Apache TinkerPop v3 compatible API, and the full Apache TinkerPop v3 query language. The goal of this type of database is to make it easier to discover and explore the relationships in a property graph with index-free adjacency using nodes, edges, and properties. In other words, every element in the graph is directly connected to adjoining elements, eliminating the need for index lookups to traverse a graph.
Through the graph-based NoSQL store it provides, IBM Graph creates rich representations of data in an easily digestible manner. If you can whiteboard it, you can graph it. All team members, from the developer to the business analyst, can contribute to the process.
The flexibility and ease of use offered by a graph database such as IBM Graph mean that analyzing complex relationships is no longer a daunting task. A graph database is the right tool for a time when data is generated at exponentially high rates amid new applications and services. A graph database can be leveraged to produce results for recommendations, social networks, efficient routes between locations or items, fraud detection, and more. It efficiently allows users to do the following:
- Analyze how things are interconnected
- Analyze data to follow the relationships between people, products, and so on
- Process large amounts of raw data and generate results into a graph
- Work with data that involves complex relationships and dynamic schema
- Address constantly changing business requirements during iterative development cycles
How a graph database works
Schema with indexes. Graph databases can either leverage a schema or not. IBM Graph works with a schema to create indexes that are used for querying data. The schema defines the data types for the properties that will be employed and allows for the creation of indexes for the properties. In IBM Graph, indexes are required for the first properties accessed in the query. The schema is best done beforehand (although it can be appended later) in order to ensure that the vertices and edges introduced along the way can work as intended.
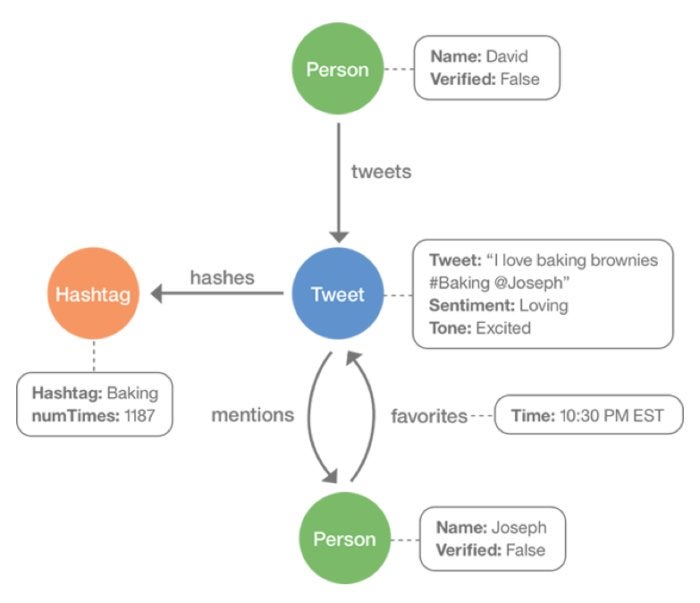
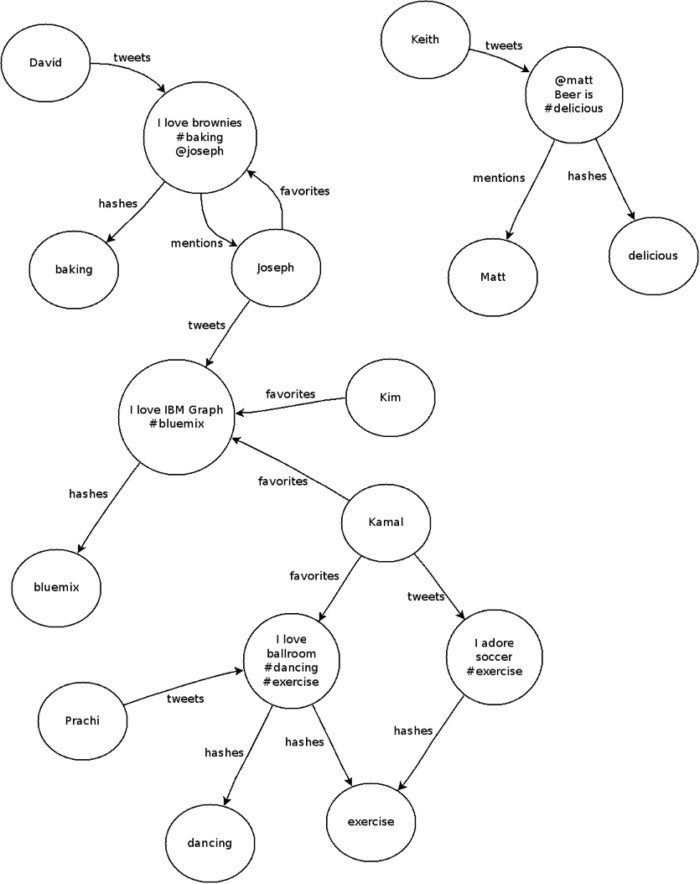
A schema should define properties, labels, and indexes for a graph. For instance, if analyzing Twitter data, the data would be outlined as person, hashtag, and tweet vertices, and the connections between them are mentions, hashes, tweets, and favorites. Indices are also created to query schemas.
 IBM
IBM
Loading data. Although a bulk upload endpoint is available, the Gremlin endpoint is the recommended method for uploading data to the service. This is because you can upload as much data as you want via the Gremlin endpoint. Moreover, the service automatically assigns IDs to graph elements when you use the bulk upload endpoint, preventing connections from being made between nodes and edges from separate bulk uploads. The response to your upload should let you know if there was an error in the Gremlin script and return the last expression on your script. A successful input should result in something like this:
 IBM
IBM
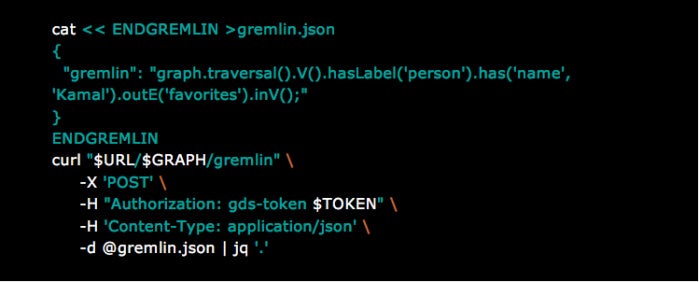
Querying data. IBM Graph provides various API endpoints for querying data. For example, the /vertices and /edges endpoints can be used to query graph elements by properties or label. But these endpoints should not be employed for production queries. Instead, go with the /Gremlin endpoint, which can work for more complex queries or for performing multiple queries in a single request. Here’s an example of a query that returns the tweets favorited by user Kamal on Twitter:
 IBM
IBM
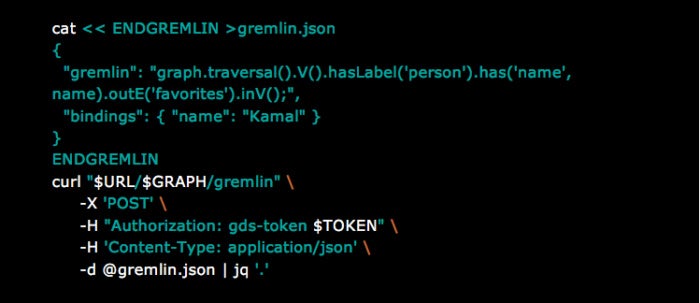
To improve query performance and prevent Gremlin query code from being compiled every time, use bindings. Bindings allow you to keep the script the same (cached) while varying the data it uses with every call. For example, if there is a query that retrieves a particular group of discrete data points, you can assign a name in a binding. The binding can then reduce the time it takes to run similar queries, as the code only has to be compiled a single time. Below is a modified version of the above query that uses binding:
 IBM
IBM
It is important to note there is no direct access to the Gremlin binary protocol. Instead, you interact with the HTTP API. If you can make a Curl request or an HTTP request, you can still manipulate the graph. You make the request to endpoints.
For running the code examples in this article locally on your own machine, you need bash, curl, and jq.
Configuring applications for IBM Graph
When creating an instance of IBM Graph service, the necessary details for your application to interact with the service are provided in JSON format.
 IBM
IBM
Service instances can typically be used by one or more applications and can be accessed via IBM Bluemix or outside it. If it’s a Bluemix application, the service is tied to the credentials used to create it, which can be found in the VCAP_SERVICES environment variable.
Remember to make sure the application is configured to use:
- IBM Graph endpoints that are identified by the
apiURLvalue - The service instance username that is identified by the
usernamevalue - The service instance password that is identified by the
passwordvalue
In the documentation, Curl examples use $username, $password, and $apiURL when referring to the fields in the service credentials.
Bluemix and IBM Graph
IBM Graph is a service provided via IBM’s Bluemix—a platform as a service that supports several programming languages and services along with integrated devops to build, run, deploy, and manage cloud-based applications. There are three steps to using a Bluemix service like IBM Graph:
- Create a service instance in Bluemix by requesting a new service instance. Alternatively, when using the command-line interface, go with
IBM Graphas the service name andStandardas the service plan. - (Optional) Identify the application that will use the service. If it’s a Bluemix application, you can identify it when you create a service instance. If external, the service can remain unbound.
- Write code in your application that interacts with the service.
Ultimately, the best way to learn a new tool like IBM Graph is to build an application that solves a real-world problem. Graph databases are used for social graphs, fraud detection, and recommendation engines, and there are simplified versions of these applications that you can build based on pre-existing data sets that are open for use (like census data). One demonstration that is simple, yet entertaining, is to test a graph with a six-degrees-of-separation-type example. Take a data set that interests you, and explore new ways to find previously hidden connections in your data.
New Tech Forum provides a venue to explore and discuss emerging enterprise technology in unprecedented depth and breadth. The selection is subjective, based on our pick of the technologies we believe to be important and of greatest interest to InfoWorld readers. InfoWorld does not accept marketing collateral for publication and reserves the right to edit all contributed content. Send all inquiries to newtechforum@infoworld.com.
Source: InfoWorld Big Data

